
If you spot “NT Kernel & System” or ntoskrnl.exe sitting near the top of Task Manager with 20, 40, or even 80 percent CPU, the first thing to know is this: the file itself is not broken, and it is not malware. ntoskrnl.exe is the Windows kernel, the core of the operating system. What you are seeing is the kernel doing extra work because something else is pushing it — almost always a driver, a background service, or a piece of hardware misbehaving. Fix the real cause, and the kernel calms down.
This guide explains what ntoskrnl.exe actually does, why it spikes, and exactly how to track down and fix the cause on Windows 10 and 11.
What is ntoskrnl.exe?
ntoskrnl.exe stands for Windows NT Operating System Kernel. It lives in C:\Windows\System32 and is loaded at startup by the Windows bootloader. It is the lowest layer of software running on your PC, responsible for scheduling CPU time across all running programs, managing RAM, handling hardware interrupts, and controlling the flow of data to storage and network devices.
Because the kernel sits between every piece of hardware and every application, it is involved in almost everything your computer does. When a driver has a problem, when RAM fills up, or when a disk floods the system with read requests, the kernel is the one dealing with it — and that work shows up as CPU usage attributed to ntoskrnl.exe in Task Manager.
Think of it like a traffic controller at a busy junction. If drivers are behaving well, the controller works easily. If one driver keeps running red lights, the controller has to intervene constantly, and suddenly it looks like the controller is causing the jam.
Why is ntoskrnl.exe using so much CPU?
The kernel handles two categories of interrupt-driven work that show up as high CPU when something goes wrong: Interrupt Service Routines (ISRs) and Deferred Procedure Calls (DPCs). When a hardware device signals the CPU — a network packet arriving, a key being pressed, a disk finishing a read — an ISR fires immediately to acknowledge it, and then a DPC runs shortly after to do the actual processing work. A driver that generates too many of these, or takes too long to handle them, creates what is called high DPC latency, and it manifests as ntoskrnl.exe CPU spikes.

Here are the most common root causes:
| Root Cause | What is Actually Happening |
| Faulty or outdated driver | Driver sends too many interrupts (DPCs/ISRs); the kernel processes them all, showing as ntoskrnl.exe usage |
| Corrupt system files | Broken kernel components force repeated retries, burning CPU |
| Antivirus / security software | Kernel-level filter drivers (AV, VPN, EDR) create extra overhead for every file or network operation |
| Windows Search indexing | Disk-heavy indexing spikes I/O, which the kernel manages, raising its apparent CPU share |
| Failing RAM or storage | Hardware errors trigger constant kernel error-handling routines |
| Memory pressure / paging | When RAM runs low, the kernel pages data to disk constantly |
The pattern most users see is a spike that coincides with something specific: plugging in a USB device, opening a browser, waking from sleep, or running antivirus scans. That timing is a clue pointing toward the real source.
Is ntoskrnl.exe a virus?
In almost all cases, no. The genuine ntoskrnl.exe file always lives in C:\Windows\System32. If you open Task Manager, right-click the “System” or “NT Kernel & System” process, and choose Open file location, it should take you straight to that folder. If the file is anywhere else — your desktop, Downloads, or AppData — treat it as suspicious and run a full malware scan immediately.
Malware sometimes impersonates system files by using a very similar name (like “ntoskrnl32.exe” or “nt0skrnl.exe”) to avoid detection. A location check takes five seconds and rules this out entirely.
| Quick check: Right-click the System process in Task Manager → Open file location. The path should be C:\Windows\System32\ntoskrnl.exe. Anything else warrants a malware scan. |
How to find the real cause (quick triage)
Before applying any fix, spend a few minutes narrowing down the source. This saves you from trying changes at random.

Step 1: Check Task Manager for timing
Open Task Manager (Ctrl + Shift + Esc) and watch the CPU column. Notice whether the spike is constant or tied to something specific — a particular app starting, disk activity, network traffic. The Performance tab also shows CPU usage history as a graph, which helps you spot whether this is continuous or comes in bursts.
Step 2: Boot into Safe Mode
Press Win + R, type msconfig, go to the Boot tab, check Safe boot with Network, and restart. In Safe Mode, Windows loads only a minimal set of drivers. If CPU usage drops to normal in Safe Mode, a third-party driver or startup service is behind the problem. If the spike persists even in Safe Mode, look toward hardware failure or corrupt system files.
Step 3: Run a clean boot to isolate software
Back in normal Windows, press Win + R and type msconfig again. Under the Services tab, check Hide all Microsoft services, then click Disable all. Switch to the Startup tab and click Open Task Manager to disable every startup item. Restart. If the CPU spike disappears, re-enable services in batches — half at a time — rebooting after each batch, until the spike returns. The last batch you enabled contains the offender.
How to fix ntoskrnl.exe high CPU — step by step
Work through these in order, checking after each one whether the problem has cleared.
1. Restart and check for a simple loop
Some DPC/ISR spikes are caused by a driver that has gotten stuck since the last boot. A clean restart clears the stuck state. After restarting, wait two or three minutes before checking Task Manager, since Windows runs several background tasks during initial boot.
2. Update your drivers, starting with the most likely offenders
Outdated or buggy drivers are the single most common cause of high kernel CPU. The priority order for updates:
- Chipset drivers — Download from Intel or AMD directly (not Windows Update). Search “Intel Chipset Device Software” or “AMD Chipset Drivers” plus your processor family.
- Storage drivers — NVMe, SATA/AHCI controller drivers from your motherboard manufacturer’s support page.
- Network adapter drivers — Realtek, Intel, or Killer networking drivers, again from the manufacturer’s site rather than Windows Update.
- GPU drivers — Latest stable release from NVIDIA or AMD. For NVIDIA, a clean install using DDU (Display Driver Uninstaller) in Safe Mode can resolve leftover driver conflicts.
- Audio drivers — Realtek HD Audio or your motherboard’s audio driver.
Open Device Manager (Win + X → Device Manager) and look for any devices showing a yellow exclamation mark. Those need driver updates first. For everything else, visit your motherboard manufacturer’s support page and download the latest packages rather than relying on “Search automatically” in Device Manager, which often installs older generic versions.
3. Repair system files with SFC and DISM
Open Command Prompt as administrator (search for cmd, right-click → Run as administrator) and run these two commands in order:
- sfc /scannow
Wait for it to complete, then run:
- DISM /Online /Cleanup-Image /RestoreHealth
SFC checks Windows system files and replaces corrupted ones from a local cache. DISM downloads fresh copies from Windows Update and repairs the component store that SFC uses. Restart after both have finished.
4. Disable Windows Search indexing (temporarily)
Press Win + R, type services.msc, and hit Enter. Scroll to Windows Search, right-click it, and select Stop. Watch Task Manager for a minute or two. If CPU drops immediately, Windows Search was the culprit. You can leave it stopped to confirm, then either leave it disabled or set it back to automatic once you’ve identified what is triggering the indexing spike (often a large file drop into a monitored folder).
5. Check your antivirus and security software
Security tools that run at the kernel level, such as antivirus, VPN clients, and endpoint detection software, add a filter layer to every disk read and network packet. On some systems or after certain updates, these filters produce excessive interrupts. Temporarily disable your security software (one at a time if you have multiple) to see whether the CPU usage drops. If it does, check the vendor’s site for a known update or patch for this issue.
6. Scan for malware
Open Windows Security (search for it in the Start menu), go to Virus & threat protection, and run a Full scan. This covers the System32 folder where ntoskrnl.exe lives. If Windows Defender finds nothing but you still suspect something, Microsoft’s free Malicious Software Removal Tool (MSRT) is a useful second opinion.
7. Adjust your power plan and PCI Express settings
Open Control Panel → Power Options and switch to Balanced if you are using a custom plan. Aggressive power-saving modes can cause the CPU and PCI devices to constantly wake and sleep, triggering interrupts. Inside the same Power Options, click Change plan settings → Change advanced power settings, expand PCI Express → Link State Power Management, and set it to Off. Also expand USB settings → USB selective suspend and disable it. These changes reduce interrupt noise from devices constantly cycling their power state.
8. Update your BIOS/UEFI firmware
Firmware bugs can expose broken interrupt routing or faulty power management tables. Visit your motherboard manufacturer’s support page (or your laptop manufacturer’s support page), find the latest stable BIOS update for your model, and follow their instructions carefully. A BIOS update is low risk when done correctly, but always note your current settings before flashing.
9. Reset or adjust virtual memory
Press Win + R, type sysdm.cpl, go to Advanced → Performance Settings → Advanced → Virtual memory → Change. Uncheck “Automatically manage paging file size for all drives,” select your C: drive, choose System managed size, click Set, then OK. This hands paging file control back to Windows and can relieve memory pressure that was saturating the kernel.
When to dig deeper: using WPR and WPA
If the steps above do not clear the problem, you need to see exactly which driver is generating the interrupt load. Windows ships with a built-in tool for this called Windows Performance Recorder (WPR). Its companion, Windows Performance Analyzer (WPA), lets you read the trace it captures.
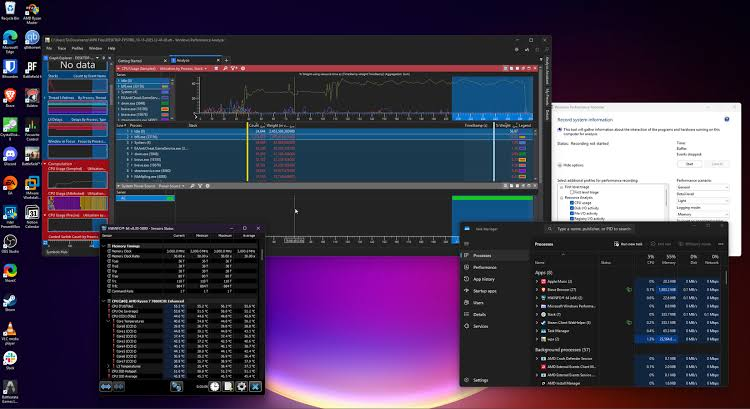
WPR.exe is already on your system no install needed. You can also get the GUI version of WPA free from the Microsoft Store, which makes reading traces much easier.
To capture a trace:
- Open an elevated Command Prompt (Run as administrator).
- Run: wpr -start CPU -start DiskIO -filemode
- Wait 30 to 60 seconds while the CPU spike is active.
- Stop the trace: wpr -stop C:\trace.etl
- Open the .etl file in WPA.
Inside WPA, open the “CPU Usage (Sampled)” view and expand the stacks column. Look for which module (a .sys file) shows the most samples. Common offenders include:
- ndis.sys — network driver issue. Update LAN or Wi-Fi adapter drivers.
- storport.sys / nvme.sys — storage driver issue. Update NVMe or SATA drivers.
- dxgkrnl.sys — GPU driver path. Reinstall GPU drivers.
- portcls.sys — audio driver issue. Update audio drivers.
- A vendor .sys file with a brand name that specific device is your target.
Once you identify the .sys file, you know exactly which driver to update, roll back, or replace. This approach cuts through ambiguity and gives you a definitive answer rather than working through fixes by trial and error.
| Tip: The free tool LatencyMon (from Resplendence Software) provides a simpler real-time view of DPC latency and names the worst-behaving drivers without requiring manual trace analysis. It is useful as a quick sanity check before diving into WPA. |
Frequently asked questions
Is ntoskrnl.exe safe, or could it be malware?
The real ntoskrnl.exe is a legitimate Windows system file and is always located in C:\Windows\System32. Right-click the System process in Task Manager and choose Open file location to verify. If it points anywhere else, scan your system for malware right away.
Why does ntoskrnl.exe spike to 100% CPU only sometimes?
Intermittent spikes usually point to a specific trigger: a device waking from sleep, a network burst, a background scan starting. Pay attention to what else is happening at the moment of the spike. That timing almost always identifies which driver or service is the cause.
Should I end or disable ntoskrnl.exe to fix the high CPU?
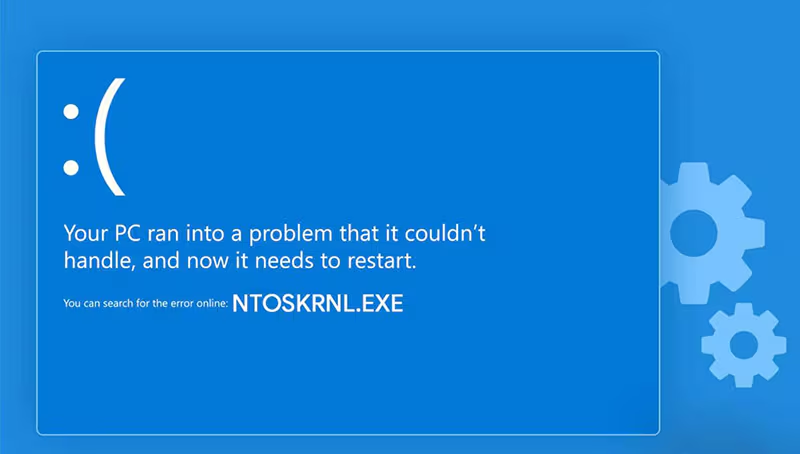
No. You cannot and should not. ntoskrnl.exe is the operating system kernel — ending it causes an immediate blue screen. The right move is to find and fix the driver or service that is pushing it into high CPU, not to touch the kernel process itself.
Does updating Windows fix ntoskrnl.exe high CPU usage?
Sometimes yes. Windows updates include driver compatibility fixes and kernel patches that can resolve known interrupt issues. Always check for pending updates as one of your early steps, but do not rely on it alone — driver updates from manufacturer sites are usually more current and targeted.
Can too little RAM cause ntoskrnl.exe to spike?
Yes. When physical RAM runs out, Windows pages data to disk, which is slow and interrupt-heavy. The kernel handles all of that paging work, and it shows up as high ntoskrnl.exe CPU. If you consistently run near your RAM limit, adding more memory is the cleanest fix.
Conclusion
ntoskrnl.exe is the Windows kernel, not a rogue process. When it shows high CPU, the real source is almost always a driver generating too many interrupts, a corrupted system file, or a background service creating excess kernel work. Start with a reboot and a Safe Mode check to confirm the pattern, then update chipset, network, storage, and GPU drivers from manufacturer pages. Run SFC and DISM to repair system files. If the problem persists, capture a WPR trace and let WPA show you exactly which .sys file is at fault. Most cases resolve after one or two driver updates.
Recommended Articles: