

The quickest way to find CPU usage in Linux is to open a terminal and run top. Look at the % CPU (s) line near the top. The id value is how much of your processor is idle, so if it reads 92.0 id, your CPU is about 8% busy. That single number answers the question for most people in about two seconds.
But top is one option out of several, and the raw numbers are easy to misread. A server can show plenty of idle CPU while one core sits pinned at 100%. Load can read 8.0 and mean two very different things depending on how many cores you have. This guide walks through six commands that check CPU usage, from a glance to a per-core breakdown, and shows you how to read what each one is telling you so the numbers actually help you fix something.
You do not need to be a system administrator to follow along. Every command here runs in a normal terminal; most are already installed, and the two that are not take one line to add. Work through them in order, and you will build a clear picture of what your processor is doing and why.
The fast answer
Run this in any terminal:
top
Press q to quit. The header shows the overall CPU state, and the process list below is sorted by the heaviest CPU users. If you want the current busy percentage as a rough figure, subtract the id (idle) value from 100. That is the whole trick. Everything past this point is about getting a clearer or more detailed picture.
Read CPU usage live with top
top is on nearly every Linux system with nothing to install. It refreshes every few seconds and shows a live view of processes and system load. The line you care about looks like this:
%Cpu(s): 7.8 us, 0.2 sy, 0.0 ni, 92.0 id, 0.0 wa, 0.0 hi, 0.0 si, 0.0 st
Each value is a percentage of total CPU time. The two you will glance at most are us (time running your own programs) and id (idle time). In the line above, the CPU is roughly 8% busy and 92% free. There is plenty of headroom here.
By default, top blends all your cores into that one line. To see cores separately, press 1 while the top is running, and the single % CPU (s) line splits into one row per core. This matters more than it sounds, and the next tools make the split even easier to read.
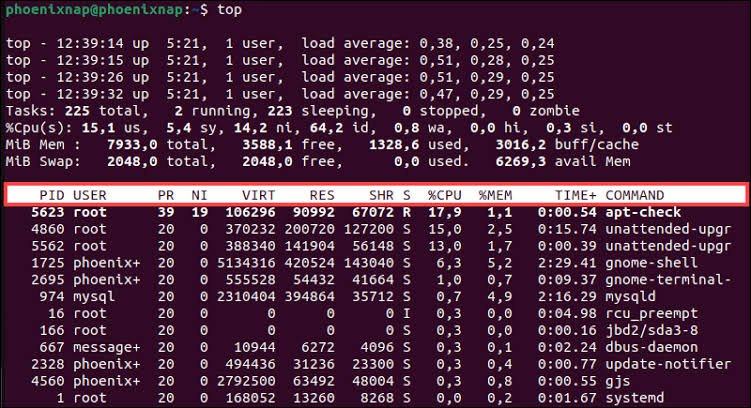
The header holds more than just the CPU line. The first row shows uptime and load average, the tasks row counts running and sleeping processes, and the two memory rows show RAM and swap use. For CPU work, you can ignore most of it and keep your eyes on the % CPU (s) line and the process list, but it is worth knowing the rest is there when you need a fuller health check.
One more useful mode: run top -bn1, and top prints a single frame and exits instead of refreshing. That is the form to use inside a script or when you want to capture the current state to a file rather than watch it live.
Tip: Inside top, press P to sort by CPU usage, M to sort by memory, and k to kill a process by its PID. Press 1 to toggle the per-core view.
htop: the friendlier live view
If top feels cramped, htop is the same idea with color, a cleaner layout, and per-core bars right at the top. It usually needs a quick install:
sudo apt install htop # Debian and Ubuntu
sudo dnf install htop # Fedora, RHEL, Rocky, Alma
Then run htop. At the top, you get a bar for each core, so a machine with 8 cores shows 8 bars. You can see at a glance whether the load is spread evenly or piled onto one core. The process list below scrolls with arrow keys, and you can filter, search, and kill processes without typing a single PID.
htop is the tool most people reach for once they have tried it. It answers “is my CPU busy, and which core, and which process” all on one screen, and it does it without you memorizing anything. The function-key menu along the bottom labels the common actions, so you can sort, search, filter, and kill processes by pointing at them.
A couple of shortcuts make it faster. Press F6 to choose what the list sorts by, pick PERCENT_CPU, and the heaviest process jumps to the top. Press F4 to filter the list to a process name, t for a tree view that shows which process spawned which, and F9 to send a kill signal. You can also launch it focused on one user with htop -u username, which is handy on a shared box.
mpstat: usage broken out per core
When you need hard per-core numbers rather than moving bars, mpstat is the tool. It comes from the sysstat package, which is not always installed by default:
sudo apt install sysstat # Debian and Ubuntu
sudo dnf install sysstat # Fedora and RHEL family
Run it with -P ALL to list every core on its own line:
mpstat -P ALL
The entire row is the average across every core, and each numbered row below it is one core. This is exactly where the most common CPU mistake hides. If the entire line looks calm at 30% busy, but one core sits at 95% while the others idle, a single-threaded program is maxing out one core and cannot spread the work, no matter how many cores the machine has.
A single snapshot shows averages since the machine booted, which can be stale. To watch live behavior, add an interval and a count. This takes five samples, two seconds apart:
mpstat -P ALL 2 5
The final Average: block sums it all up, which is handy for capturing what the CPU did during a busy stretch. Full option details live in the mpstat manual page.
vmstat and iostat: a quick number and I/O context
Two more built-in tools give useful CPU context. vmstat prints one compact line of system stats, with CPU percentages at the far right:
vmstat 1

The 1 tells it to refresh every second. In the CPU group at the right, us is user time, sy is system time, and id is idle. If idle reads 70, your CPU is about 30% busy. It is a fast way to get a number without the full process list.
iostat, also from sysstat, pairs CPU usage with disk activity. That combination is useful because a slow system is often waiting on the disk, not the processor:
iostat
The avg-cpu section at the top shows average CPU usage since boot, including a %iowait figure. High iowait means the CPU is sitting idle while it waits for the disk to catch up, so the fix is faster storage, not a faster CPU.
To make iostat live and readable, add the extended flag and an interval: iostat -x 2 refreshes every two seconds and adds per-disk detail, including a %util column. When %util on a disk climbs toward 100% at the same moment %iowait rises, you have confirmed the disk, not the processor, is what is holding the system up.
Which command should you use?
Each tool has a job it does best. Here is a quick way to pick.
| Command | Best for | Installed by default? |
|---|---|---|
| top | A fast live look at overall usage and top processes | Yes |
| htop | The same, but easier to read, with per-core bars | Usually no |
| mpstat | Exact per-core numbers and spotting one busy core | No (sysstat) |
| vmstat | One quick line with a usage number | Yes |
| iostat | CPU usage alongside disk I/O wait | No (sysstat) |
| GUI monitor | A visual view on a desktop, no terminal needed | Varies |
For everyday checks, top or htop covers most needs. When you suspect one core is the problem, reach for mpstat -P ALL.
What the CPU numbers actually mean
Every one of these tools breaks CPU time into the same handful of categories. Knowing them turns a wall of numbers into a diagnosis. Here is what each abbreviation stands for and why it matters.
- us (user): time running your own programs and applications. This is the “good” busy, the actual work you asked for.
- sy (system): time the kernel spends on your behalf, like handling system calls and memory. Steadily high system time often points to I/O-heavy work.
- id (idle): time the CPU did nothing. High idle is healthy and means you have spare capacity.
- wa (iowait): time the CPU sat idle waiting on the disk or network. Sustained iowait above 10 to 15% usually means storage is your bottleneck, not the processor.
- ni (nice): time spent on deliberately low-priority processes. Usually small.
- st (steal): time a hypervisor took away for another virtual machine. This only appears on VMs and cloud servers. If steal stays above 10%, the host is overcommitted, and you are not getting the CPU you pay for.
The simplest read: watch the id (idle) figure. Subtract it from 100, and you have your rough CPU usage. Then, if the machine feels slow but idle looks high, check wa and st before blaming the processor.
Load average vs CPU usage
These two get mixed up constantly, and they measure different things. You will see load average in top, htop, and uptime, shown as three numbers:
load average: 1.06, 1.05, 1.00
Those are the average number of processes running or waiting for resources over the last 1, 5, and 15 minutes. It is a count, not a percentage. The key is to compare it against your core count. A load of 1.0 fully occupies a single-core machine, but on a quad-core box, a load of 4.0 is full capacity, and 1.0 means it is only about a quarter busy.
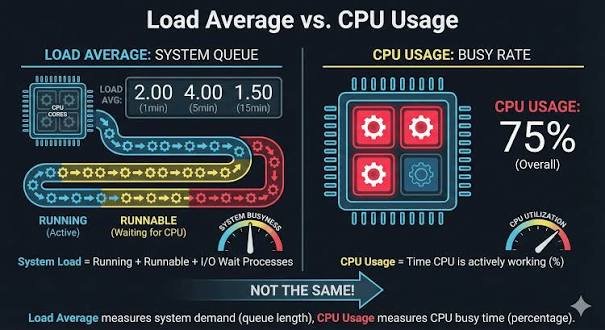
Rule of thumb: if the load average is consistently higher than your number of cores, processes are queuing and waiting their turn. A load of 8.0 on a 4-core system means it is trying to do twice the work it can handle at once.
Check your core count with nproc. So CPU usage tells you how hard the processor is working right now, while load average tells you how many tasks are lined up over time. You want both to make sense of a slowdown.
Find which process is eating your CPU
Knowing the CPU is busy is only half the answer. The other half is which program is responsible. The fastest route is already in front of you: top and htop both sort by CPU usage by default, so the worst offender sits at the top of the list.
For a one-shot snapshot, you can script, ps sorts processes by CPU without a live refresh:
ps -eo pid,ppid, cmd,%cpu –sort=-%cpu | head -10
This prints the top 10 CPU users right now. One caution: ps reports CPU averaged over the life of the process, not the current instant, so for a live figure, trust top or htop instead. A process whose TIME+ value climbs fast at the top is one that is actively churning, and that is usually your culprit.
For per-process history over time, pidstat (also from sysstat) samples each process at an interval. Run pidstat 2, and it reports CPU per process every two seconds, which is better than a single snapshot for catching a program that spikes and then settles.
Reading high CPU usage: three common patterns
Once you can see the numbers, the useful skill is knowing what they point to. Most CPU problems fall into a few recognizable shapes, and each one has a different fix. Here are the three you will meet most often.

One core is pinned, the rest are idle
If mpstat -P ALL shows a single core near 100% while the others coast, a single-threaded program is the cause. It can only use one core, so adding cores will not help. The fix is on the software side: run more copies of the program across cores, or use a version that supports multiple threads. This is the pattern quick guides miss, because the blended average looks perfectly healthy.
High system or iowait time
If sy (system) or wa (iowait) is high rather than us (user), the processor is not doing your work; it is waiting or handling overhead. Sustained iowait points at the disk, so check it with iostat -x 2. Heavy system time can mean a program making a flood of system calls or heavy network traffic. In both cases, a faster CPU is the wrong answer.
High steal time on a VM
On a cloud server or virtual machine, watch the st (steal) figure. If it sits above 10%, the physical host is overcommitted and is handing your CPU time to other tenants. There is nothing to tune inside your machine here. The answer is to move to a less crowded host or a plan with guaranteed CPU.
Quick decision: high us means a real workload to optimize or scale, high wa means storage, high sy means overhead, and high st means the host. Read which category is high before you spend money on hardware.
Track CPU usage over time
The commands so far show the present moment. When you are chasing a slowdown that already happened, or planning capacity, you want a record. That is where historical tools earn their place.
The sar command, part of sysstat, reads data that the system collects on a schedule. Once sysstat’s collection service is enabled, sar -u shows CPU usage in past intervals, so you can see what the processor was doing at 3 a.m. without having watched it live. Enable collection with your service manager, then let it gather a day or two of baseline before you need it.
For a rolling live figure, you can also just log a command. Running mpstat -P ALL 1 600 > cpu.txt records one sample per second for ten minutes and writes an average at the end, which is a simple way to capture what the CPU did during a busy period for later reading.
Check CPU usage without the command line
If you are on a Linux desktop and would rather not touch a terminal, most environments ship a graphical monitor that works like the Task Manager on Windows. GNOME has System Monitor, and KDE has System Monitor as well, both with a live CPU graph and a sortable process list.
On Ubuntu with GNOME, you can launch it from a terminal or the app menu:

gnome-system-monitor
The Resources tab draws a live line graph per core, and the Processes tab lists what is running so you can sort by CPU and end a stuck program with a click. On a headless server, there is usually no GUI, which is exactly why the command-line tools above are worth knowing. But for a desktop, this is the friendliest option of all.
Frequently asked questions
How do I check CPU usage in Linux without installing anything?
Run top or vmstat 1. Both ship with almost every Linux system. In the top, read the % CPU (s) line and subtract the idle value from 100 for a quick busy percentage.
Why does the top show high CPU when my system feels fine?
top blends all cores into one line, so one busy core can look alarming. Press 1 to split the view per core, or run mpstat -P ALL to see whether only a single core is loaded.
What is a normal CPU usage percentage?
There is no single number. Short spikes to 100% during heavy tasks are fine. Constant high usage with no clear cause is the warning sign. Watch the idle figure over time rather than any one reading.
How do I see CPU usage per core in Linux?
Run mpstat -P ALL for exact per-core numbers, or press 1 inside top. htop also shows a separate live bar for each core at the top of its display.
Is load average the same as CPU usage?
No. CPU usage is how hard the processor is working right now, as a percentage. Load average is the number of processes running or waiting, averaged over time. Compare the load average against your core count to read it correctly.
Conclusion
To find CPU usage in Linux, run top and read the %Cpu(s) line, subtracting the idle value from 100 for a rough busy figure. Use htop for a clearer per-core view, and mpstat -P ALL when you need to catch one overloaded core. A good result is a clear read: you know how busy the CPU is, whether the load is spread evenly, and which process is responsible. Match the tool to the question and the numbers stop being a mystery.
Recommended Articles:
Why Your Motherboard’s BIOS Might Be Limiting Your CPU (And How to Fix It)
Minecraft Server CPU Requirements: What You Actually Need
Plex Says “Not Enough CPU for Conversion of This Item”: How to Fix It
Intel CPU Roadmap Leak: Everything We Know About Nova Lake, Panther Lake, and Beyond
AMD Zen 6 CPU Leak Details: Everything We Know So Far About AMD’s Next-Generation Ryzen Processors