
Windows Problem Reporting is using a lot of CPU because it is stuck trying to report the same crash over and over. The quick fix is to find the app that keeps crashing, restart the Windows Error Reporting Service, then repair Windows system files. Do that in order and the CPU spike usually clears within a few minutes.
You will see this in Task Manager as “Windows Problem Reporting,” or under the file names WerFault.exe and wermgr.exe. Normally these run for a second or two after a program crashes and then close on their own. When one hangs around and pins a CPU core, something behind it is broken. This guide walks through what the process is, why it eats CPU, and the exact steps to stop it, from the easy ones to the deeper fixes.
What is Windows Problem Reporting?
Windows Problem Reporting is the part of Windows that collects details when an app, driver, or system component crashes, and offers to send that report to Microsoft. It is also called Windows Error Reporting, or WER for short. Microsoft uses these reports to spot common bugs and push fixes through Windows Update.

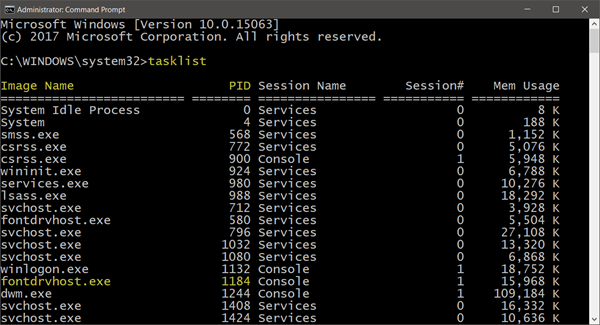
Two files do the work. WerFault.exe is the piece that catches the crash and gathers the details, like which program failed and what the error code was. Wermgr.exe (the Windows Error Reporting Manager) handles the report after that, including sending it. In Task Manager both may show up under the friendly name “Windows Problem Reporting,” which is why the label can point at either file.
Both live in the C:\Windows\System32 folder. That location matters, and we will come back to it, because a file with the same name sitting somewhere else is a warning sign.
Why does it use so much CPU?
The usual cause is a crash loop. An app or driver keeps failing, Windows keeps launching the reporting process to log it, and the two get stuck feeding each other. Because the same report never finishes, the process runs non-stop instead of closing after a second or two. On a machine with few cores, one stuck instance can look like a solid 25 percent in Task Manager, since it is holding a whole core.
A few things set this off:
- A program that crashes again and again in the background, often a browser, game, antivirus tool, or sync app like OneDrive.
- A report that Windows cannot finish, sometimes for an app that is no longer installed.
- Corrupted or outdated device drivers that keep throwing errors.
- Damaged Windows system files or a broken crash log the service cannot clear.
- Malware pretending to be WerFault.exe to hide in plain sight.
High CPU for a long stretch is not just annoying. It heats up the machine, spins the fans, drains a laptop battery fast, and can make everything else feel slow. So it is worth fixing rather than living with.
First, rule out malware
Before changing settings, make sure the process is the real one. Real WerFault.exe and wermgr.exe files sit in C:\Windows\System32. Malware sometimes copies the name to blend in.

In Task Manager, right-click the process and choose Open file location. If it opens the System32 folder, the file is genuine. If it points anywhere else, treat it as suspect. Run a full scan with Windows Security (Settings, then Privacy and Security, then Windows Security, then Virus and threat protection) and pick Full scan, not Quick scan. Remove anything it flags, restart, and check again.
If the file is legitimate and CPU is still high, move on to the fixes below.
Fix 1: Find and repair the app that keeps crashing
Since the reporting process is usually reacting to something else failing, finding that thing fixes the real problem. Windows has two built-in tools that make this easy.
Reliability Monitor gives you a simple timeline. Press the Windows key, type “reliability,” and open View reliability history. Look for red X marks around the time the CPU spike started. Click one to see which app or driver failed. This is often quicker than Event Viewer because it lays failures out by date.
For more detail, use Event Viewer. Press Windows key plus X and choose Event Viewer, then go to Windows Logs and Application. Filter for Error and look for entries near the time of the spike. Fields like “Faulting application name” and “Faulting module name” tell you the culprit.
Once you know the app, update it, repair it, or reinstall it. If it is a driver, get the newest version from the maker’s site rather than relying on an old one. Fixing the crash removes the reason the reporting process keeps running.
Fix 2: Restart the Windows Error Reporting Service
If the same report is looping, restarting the service clears it without touching system files. This is a safe, quick step.
- Press Windows key plus R, type services.msc, and press Enter.
- Scroll to Windows Error Reporting Service in the list.
- Right-click it and choose Restart. If it is stopped, choose Start instead.
- Leave the startup type at its Windows default.
- Reboot and watch Task Manager to see if the spike returns.
A restart often ends a stuck report on its own. If the process fires back up right away, the crash behind it is still active, so pair this with Fix 1.
Fix 3: Repair corrupted system files
Damaged system files can keep the reporting process from finishing its work. Two built-in commands check and repair them. Run them in this order.
Open the Start menu, type “cmd,” right-click Command Prompt, and choose Run as administrator. Then run:
sfc /scannow
Let it finish. It scans protected system files and swaps any broken ones for good copies. If it finds problems it cannot fix, run this next:
DISM /Online /Cleanup-Image /RestoreHealth
DISM repairs the underlying Windows image that SFC pulls its copies from, so running DISM and then SFC again clears cases the first pass missed. Restart when both are done.
Fix 4: Do a clean boot to find a background conflict
If the spike shows up at startup or every few minutes, a background service or startup app is probably crashing. A clean boot starts Windows with only Microsoft services and no extra startup programs, so you can find the troublemaker.

- Press Windows key plus R, type msconfig, and press Enter.
- On the Services tab, tick Hide all Microsoft services, then click Disable all.
- On the Startup tab, open Task Manager and disable each startup app.
- Restart the PC and watch the CPU.
If the spike is gone, one of the disabled items was the cause. Turn them back on in small groups, restarting each time, until the CPU jumps again. The last group you enabled holds the offender. Then remove or update that program.
Fix 5: Adjust or turn off Problem Reporting
If nothing above sticks and you just need the CPU back, you can change how Problem Reporting behaves or switch it off. Turning it off does not harm Windows. Your crash details still show in Event Viewer, so nothing is hidden from you locally. The only trade-off is that crash reports no longer go to Microsoft.
The gentle option is to stop it running on its own. Open the Start menu, type “control,” and open Control Panel. Go to System and Security, then Security and Maintenance, and open Problem reporting settings under Maintenance. Choose “Each time a problem occurs, ask me before checking for solutions.” Now it will not run in the background without asking.
To switch it off fully, open Services (services.msc), double-click Windows Error Reporting Service, set Startup type to Disabled, click Stop, then OK. On Windows Pro or Enterprise you can also do this through Group Policy. Microsoft’s own guide on Windows Error Reporting settings lists the Group Policy and registry options in one place if you manage several machines.
Quick tip: try Fixes 1 through 3 before disabling anything. Turning off reporting hides the symptom, but a crashing app or bad driver will keep causing trouble elsewhere until you deal with it.
Frequently asked questions
Is it safe to end Windows Problem Reporting in Task Manager?
Yes. Ending it stops the current CPU spike and Windows will restart the process only when it is needed again. It is a fine short-term fix, but it will not stop a crashing app from triggering it once more.
Is WerFault.exe a virus?
Not by itself. The real file sits in C:\Windows\System32 and is a normal Windows process. Malware sometimes borrows the name, so if the file opens from a different folder, run a full Windows Security scan.
Will disabling Windows Error Reporting break anything?
No. Windows keeps working normally and your crash logs still appear in Event Viewer. The only change is that crash reports stop going to Microsoft, so you lose automatic help finding solutions.
Why do I see several WerFault.exe processes at once?
Each crashing app can spawn its own instance, so multiple entries usually mean multiple programs are failing. Use Event Viewer or Reliability Monitor to find which apps are involved and repair them.
Does high CPU from Problem Reporting mean my PC is damaged?
Usually not. It almost always points to a software crash loop or a stuck report, which the steps above fix. Repeated random crashes across many apps can point to bad RAM or overheating, which is worth checking separately.
Conclusion
Windows Problem Reporting spikes the CPU when it gets stuck reporting a crash on a loop. Start by confirming the process is genuine and sitting in System32, then find the crashing app with Reliability Monitor, restart the Windows Error Reporting Service, and run SFC and DISM to repair system files. A clean boot catches background conflicts. A healthy result is the process flashing on briefly after a crash and closing on its own, with your CPU back to normal.
Recommended Articles:
How to Increase CPU Memory (What It Really Means and What Actually Works)
Endpoint Protection Service Using High CPU? Here’s How to Find the Cause and Fix It
100% CPU Usage While Gaming: What It Means and How to Fix It
Plex “Not Enough CPU for Conversion of This Item”: Causes and Fixes