

When an IIS worker process (w3wp.exe) pegs the CPU, the fix is almost always in your application code, not in IIS itself. Recycling the pool buys you a few minutes and the CPU climbs right back. The real work is matching the busiest w3wp.exe process to an app pool, capturing data while the CPU is actually high, and reading the call stacks to see which code is burning the cycles.
This guide walks through that process in order: identify, capture, analyse, fix. You can do all of it with free tools that run on the server you already have.
What is the IIS worker process and why does it use so much CPU?
The IIS worker process, w3wp.exe, is the Windows process that runs your website’s code. Each application pool gets its own w3wp.exe. When a request comes in, IIS hands it to the worker process for that pool, which runs your .NET code, talks to the database, and builds the response.

High CPU means one of two very different things, and telling them apart is your first job:
- Healthy load. More traffic means more CPU. A site serving twice as many requests should use roughly twice the CPU, and response times stay flat.
- A problem. CPU is high but requests are slow, queueing, or failing. The work being done is out of proportion to the work being asked for.
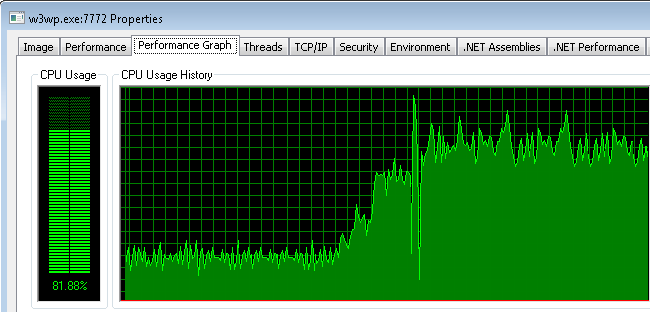
The second one is what most people mean by “high CPU”. A good rule of thumb: if CPU sits above 80 percent for long stretches while response times get worse, treat it as a fault. If CPU is at 90 percent and everyone is being served fast, you may just need a bigger server.
Three signals separate the two cases quickly. Check whether requests are queueing, because a healthy busy server keeps its queue near zero while a struggling one builds a backlog and eventually returns 503 errors. Check whether CPU falls back to normal when traffic drops, since a runaway loop keeps burning cycles at 3am when nobody is on the site. And check whether a recycle helps for a while, because a problem that resets and then rebuilds over minutes points to something accumulating inside the process rather than raw demand.
Which application pool is using the CPU?
Task Manager tells you w3wp.exe is busy, but not which site. On a server with ten app pools you will see ten identical process names. Match the process ID to a pool with one command.
Open an admin command prompt and run:
cd %windir%\System32\inetsrv
appcmd list wp
You get a list like WP “13780” (applicationPool:MyStoreAppPool). Take the PID from Task Manager’s Details tab and find it in that list. That is your culprit pool.
Two faster alternatives:
- In Task Manager, right-click the column headers and add the Command line column. The -ap “PoolName” argument names the pool directly.
- In IIS Manager, click your server, open Worker Processes, then double-click a process to see every request it is running right now, with the URL and how long each has been going.
That last view is worth a minute of your time before you touch any tooling. If forty requests are all sitting on the same URL, you have already narrowed the search enormously.
What causes high CPU in w3wp.exe?
Most cases come down to a short list. Work through it before assuming you need a bigger machine.
Inefficient code in a hot path. A loop that does string concatenation instead of using StringBuilder, a regular expression that backtracks, a sort running on every request. Microsoft’s own worked example is a page that builds an HTML table by concatenating strings 5,000 times in Page_Load. It looks harmless and it eats a core.
Garbage collection. The .NET runtime cleans up unused objects, and if your app allocates heavily, that cleanup can consume a large share of CPU. Watch the .NET CLR Memory\% Time in GC counter. Under about 5 percent is comfortable. Sustained readings above 10 percent mean allocation patterns are your problem, and anything near 30 percent or higher is serious. Gen 2 and large object heap collections are the expensive ones, so look for big objects and long-lived caches rather than ordinary short-lived variables.
Infinite or runaway loops. A while loop with a condition that never turns false will hold a core at 100 percent forever. These show up clearly in dumps because the same method sits on top of the stack in every snapshot.
High error rates. Throwing and catching exceptions is expensive. An app quietly throwing thousands of exceptions a minute can burn serious CPU while looking fine to users.
Antivirus scanning. Real-time scanning of the IIS temporary files and compiled ASP.NET assemblies causes CPU spikes that look like application problems. Excluding the IIS install and temp folders is a standard fix.
A slow dependency causing pile-up. When a database or API call slows down, requests stack up. Thread pool growth, retries, and timeout handling all cost CPU, so a downstream problem shows up as a CPU problem on the web tier.
A traffic change. Bots, a scraper, or a new feature that calls an endpoint ten times per page. Check the IIS logs at C:\inetpub\logs\LogFiles for a jump in request volume, and sort by the time-taken field to spot expensive URLs.
What to do first while the server is struggling
Diagnosis takes time you may not have while users are waiting. Do these three things in order.
Recycle the app pool that you identified, from IIS Manager or with appcmd recycle apppool /apppool.name:”YourPool”. This clears the process and gives you breathing room. It drops the requests in flight, so it is a stopgap, not a fix.
Before that recycle, spend thirty seconds in the Worker Processes view writing down the URLs that are running. Recycling destroys that evidence, and those URLs are often the whole answer.
If one endpoint is clearly responsible and you can afford to lose it, stop it rather than the whole site. Taking one page or API route offline keeps the rest of your application serving while you work out what went wrong.
How to capture data while CPU is high
You cannot diagnose this after the fact. You need data from the moment the CPU is actually high, which means setting up collection before or during the incident.

Step 1: Start a Performance Monitor data collector set
Perfmon gives you the shape of the problem. Create a user-defined data collector set with these counters at minimum:
- Process \ % Processor Time, for all instances
- Thread \ % Processor Time and ID Thread, for all instances
- .NET CLR Memory counters, if it’s an ASP.NET app
- ASP.NET and ASP.NET Applications counters
The thread-level counters matter. They let you tie CPU consumption to a specific thread ID, which is what you match against the dump.
Step 2: Collect memory dumps with DebugDiag
DebugDiag is the free Microsoft tool for this. Create a Performance rule, set a Performance Counters trigger on Processor \ % Processor Time for the _Total instance, set the threshold to Above 80 for 20 seconds, and add your application pool as the dump target.
Twenty seconds matters. A shorter window fires on normal traffic spikes and fills your disk with useless dumps.
A few rules for good dumps:
| Rule | Why it matters |
|---|---|
| Collect three dumps | One snapshot can’t tell a busy thread from a stuck one |
| Space them about 10 seconds apart | The same threads stay alive across all three, so you can compare |
| Use the same process ID every time | A recycled pool gives you a new PID and unusable data |
| Capture when w3wp is high, not just the server | Another process may be the real CPU hog |
Avoid taking dumps when CPU is already above 95 percent. Threads pause while a dump is written, and on a server that is already saturated this can push it into becoming unresponsive.
Step 3: Or collect an ETW trace with PerfView
Dumps freeze threads. On a production server at peak, that pause is sometimes unacceptable. PerfView collects ETW traces instead, with very little performance cost, which makes it the safer choice on a live site.
Run PerfView as administrator, choose Collect, tick Zip, Merge and Thread Time, then open Advanced Options and tick IIS. Start collection, let the problem happen, stop collection.
The trade-off: a trace shows CPU consumption over time in detail but not the contents of objects in memory. Use a trace when CPU is high and memory looks normal. Use a dump when both are high.
How to read the results and find the code
Open DebugDiag, go to the Advanced Analysis tab, choose Performance Analyzers, add all your dump files, and start the analysis. It takes a few minutes.

The report gives you the top threads by average CPU time. Click through to the call stacks. You are looking for the same method appearing at the top of the stack across all three dumps, because that is code that was running the whole time rather than a thread you caught mid-request.
Read the stack from the bottom up. The bottom frames tell you which page or handler triggered the work. The top frames tell you what it was actually doing. A stack ending in System.String.Concat points at string building. A stack full of GC frames points at allocation. A stack sitting in your own method with a loop in it points exactly where you would hope.
Then match it against the Perfmon data. If the thread IDs burning CPU in Perfmon are the ones DebugDiag flagged, you have your answer.
Two things commonly send people down the wrong path here. The first is a stack full of runtime and framework frames with none of your own code visible. That does not mean the framework is at fault; it means your code called into it with bad inputs or in a bad pattern, so keep reading down the stack until you reach a method you wrote. The second is a thread that looks busy in one dump and idle in the next. That thread was just doing its job. Only threads that stay busy across all three snapshots are worth chasing.
If the top stacks are dominated by garbage collection frames, stop looking at the stacks and go back to the memory counters. GC-driven CPU is a symptom of how much your app allocates, and the fix is in allocation patterns: caching large objects instead of rebuilding them, avoiding huge in-memory collections per request, and disposing of unmanaged resources properly rather than waiting for the collector to get to them.
How to fix it and stop it happening again
Fix the code first. That’s where the cause almost always is: rewrite the hot loop, cache the expensive result, add the missing database index, use StringBuilder, or fix the exception being thrown on every request.
Then add guardrails so a single pool can’t take down the server.

IIS can cap CPU per application pool. In IIS Manager, select the pool, click Advanced Settings, and look at the CPU section. The CPU limit settings give you four choices for Limit Action:
| Limit Action | What it does |
|---|---|
| NoAction | Logs a warning to the event log only |
| KillW3wp | Shuts down the worker process when it passes the limit |
| Throttle | Caps CPU at your limit at all times |
| ThrottleUnderLoad | Caps CPU only when other processes are competing for it |
ThrottleUnderLoad is usually the sensible default on a shared server. Your app gets the full machine when nothing else needs it, and gets held to its limit when the server is busy. KillW3wp is blunt, and it means dropped requests. Throttling arrived in IIS 8.0, so older servers only offer the first two options.
One catch: in IIS 8.5 and later, IIS Manager takes the limit as a plain percentage, but the underlying applicationHost.config file always stores it in thousandths of a percent. A 50 percent cap is written as limit=”50000″.
Beyond that, three habits prevent most repeat incidents:
- Give every site its own application pool, so one bad app can’t starve the others.
- Turn on all the IIS log fields, especially time-taken, so slow URLs are visible before users complain.
- Watch % Time in GC and error rates after every deployment. Both catch regressions early, while the change that caused them is still fresh.
Frequently asked questions
Is it safe to restart the IIS worker process when CPU is at 100 percent?
Yes. Recycling the app pool in IIS Manager drops in-flight requests but restores service without rebooting Windows. It is a stopgap only, since CPU usually climbs back once load returns.
Why does w3wp.exe use high CPU when nobody is on the site?
Usually background work: scheduled jobs, cache refreshes, a runaway loop left over from an earlier request, or antivirus scanning IIS temp folders. Bots and scrapers also generate real traffic that no human triggered.
How much CPU is too much for an IIS worker process?
Sustained usage above 80 percent is the common warning line, but the number matters less than the effect. If response times stay flat, high CPU is fine. If requests slow down or queue, investigate at any level.
Can I limit how much CPU one application pool uses?
Yes. Set a CPU Limit and a Limit Action in the pool’s Advanced Settings. ThrottleUnderLoad caps usage only when other processes need CPU, which protects the server without killing your app.
Does adding more CPU cores fix the problem?
Only if the cause is genuine traffic growth. If a loop or a garbage collection issue is burning cycles, more cores give you more headroom before it hurts, but the underlying fault stays.
Conclusion
High CPU in an IIS worker process is a code problem in almost every case. Match the busy w3wp.exe to its application pool with appcmd list wp, capture three dumps or an ETW trace while CPU is genuinely high, and read the top call stacks to find the method doing the work. Fix that code, then set a per-pool CPU limit as a safety net. A healthy result is CPU that rises and falls with traffic while response times stay flat.
Recommended Articles:
Windows Problem Reporting High CPU: How to Fix It Fast
svchost.exe High CPU: How to Find the Real Cause and Fix It
How to Increase CPU Memory (What It Really Means and What Actually Works)
Endpoint Protection Service Using High CPU? Here’s How to Find the Cause and Fix It
100% CPU Usage While Gaming: What It Means and How to Fix It